AI Agent Storage Selection: How Curvine Supports 10,000-Scale Agent Workloads on EKS
I. The Storage Challenge of Large-Scale AI Agent Deployment
In 2026, AI infrastructure is undergoing a fundamental architectural shift: from a centralized model where one large model instance serves all requests, to a distributed model where thousands of Agent instances run independently.
This is not a conceptual change. Take frontend development with Vite as an example: during debugging, an Agent needs to run build tools like Vite. The Vite dev server depends on high-speed random reads of node_modules and source directories for on-demand compilation and Hot Module Replacement (HMR). Developers expect to see page changes within milliseconds after saving a file. This places high demands on small-file random read performance and low-latency file system event notifications (inotify/fswatch). If the storage layer cannot keep up, the entire development experience becomes sluggish.
Every Agent instance is not a stateless HTTP handler, but a stateful process with its own working directory and persistent storage needs. Platforms like OpenClaw build their entire memory and collaboration system on files: SOUL.md defines the agent's personality and behavioral boundaries, AGENTS.md describes behavior rules and session workflows, MEMORY.md stores long-term memory across sessions, plus USER.md, TOOLS.md, HEARTBEAT.md, and other Markdown files automatically loaded at startup — along with project source code, node_modules, and .git history. Each agent instance runs in an isolated sandbox where these files are constantly read, written, and updated. When a platform allocates dedicated agent instances to thousands of developers simultaneously, you get a classic "tens of thousands of independent file systems" requirement: each instance needs an isolated POSIX workspace with dense file counts and frequent I/O.
From Kubernetes' perspective, this means your cluster must simultaneously support thousands or even tens of thousands of independent PersistentVolumeClaims. Each PVC must provision quickly — Agent elastic scaling cannot wait minutes for storage. You need low-latency file I/O, and data must remain accessible after a Pod is rescheduled to another node.
This "massive small-scale stateful instances" workload pattern is fundamentally different from traditional stateful applications like databases and message queues, which typically use a few large PVCs. The former requires tens of thousands of small PVCs. Native AWS storage services each have different strengths and weaknesses when facing this new pattern.
1.1 Amazon EBS: Strong Isolation, but Attachment Limits Are Hard Constraints
EBS excels at isolation. One independent EBS volume per Agent means performance does not interfere across tenants, and failures do not spread. For scenarios requiring strict tenant isolation, this is the cleanest approach.
The problem: the number of EBS volumes a single EC2 instance can attach has a hard upper limit. For most Nitro instances (including the r6g series used in this test), the maximum attachment count is 28, shared with network interfaces and NVMe instance store. After accounting for the primary network interface, the practical EBS volume limit is around 27. Some 7th-generation instance types (such as M7i and R7i) introduced independent EBS volume limits with higher quotas based on instance size, but for r6g instances still under shared limits, 28 is the ceiling. (Reference: Amazon EBS volume limits for Amazon EC2 instances)
What does this mean in practice? In our test scenario, each r6g.4xlarge node ran approximately 100 Agent Pods. If EBS allocated an independent volume to each Pod, a single node could mount at most 28 volumes — requiring nearly 4× the number of nodes to carry the same Pod density, dropping compute resource utilization from 88% to around 20%.
Additionally, EBS volumes are bound to a single Availability Zone and cannot be used across AZs. Once a Pod is scheduled to a node in a different AZ, the original EBS volume becomes unreachable, forcing Pod scheduling constraints to specific AZs. For Agent platforms requiring cross-AZ high availability and rapid elastic scaling, this is an architectural hard constraint.
1.2 Amazon EFS: Mature Isolation, but Mass Provisioning Is the Bottleneck
As a managed NFS file system, EFS combined with Access Points can allocate an isolated directory view for each Agent. Each Access Point has independent POSIX permissions and a root directory, achieving file-system-level tenant isolation. EFS supports ReadWriteMany, so Pods can be rescheduled across nodes without detach/attach operations — ideal from a scheduling flexibility perspective. Since February 2025, a single EFS file system supports up to 10,000 Access Points, sufficient for tens-of-thousands Agent scenarios from a quota perspective.
However, in actual large-scale deployments, the bottleneck appears in provisioning speed. When dynamically provisioning thousands of PVCs simultaneously through the EFS CSI Driver, each PVC corresponds to an Access Point creation. The EFS API has rate limits on Access Point creation, and the CSI controller must call the API serially or in small batches.
1.3 Amazon S3: Unlimited Capacity, but Not a File System
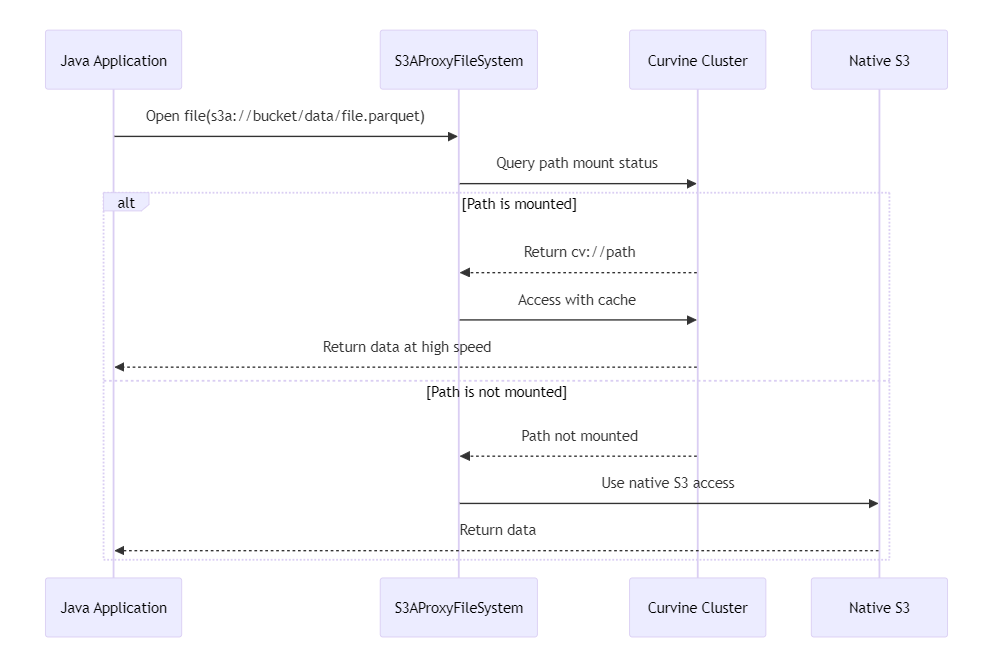
S3's scalability and cost efficiency are undeniable — it works well as the final archival layer for Agent data. But Agents at runtime need POSIX file semantics: open, read, write, seek, rename, and list directory. S3 is object storage — it does not support in-place modification, atomic rename, or consistent directory listing semantics.
Mountpoint for Amazon S3 provides a FUSE mount solution, but it explicitly supports only sequential writes to new files and reads of existing files — not random writes or modifications to existing files. For Agent workflows that repeatedly modify context files, append logs, and update checkpoints, this is not a viable runtime storage solution.
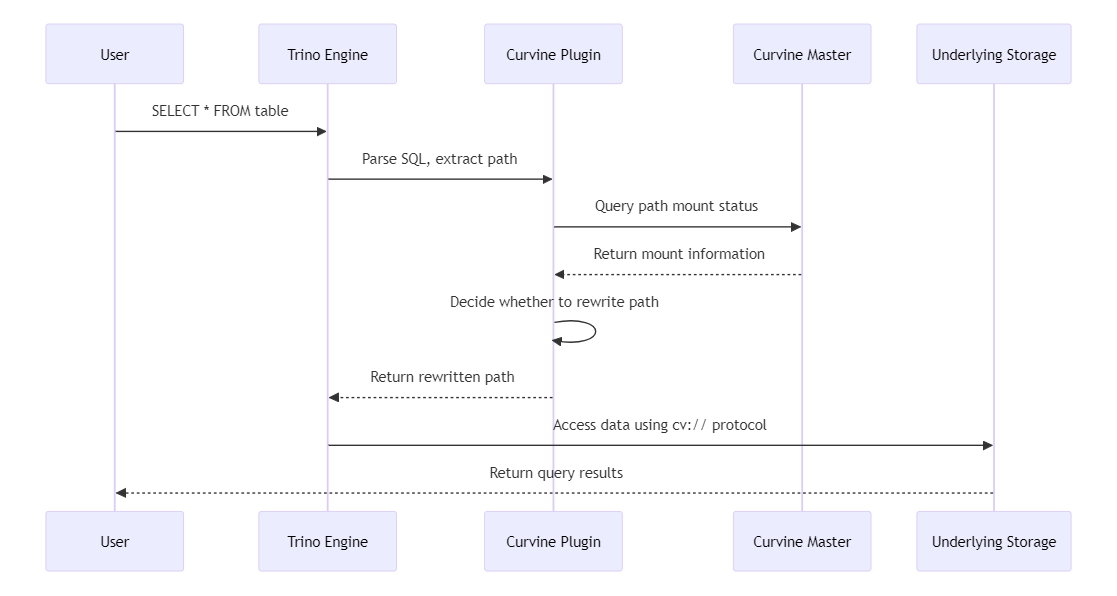
II. Curvine: A Distributed Cache File System Designed for Agent Scale
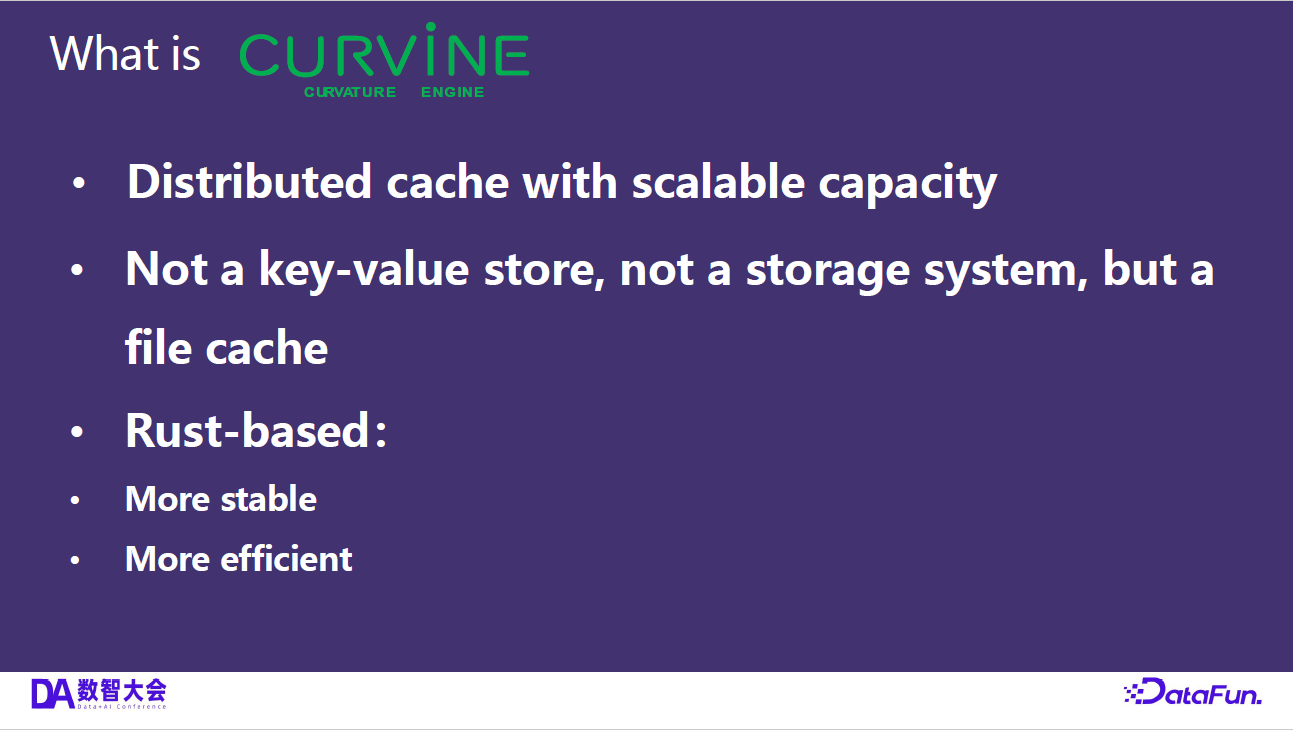
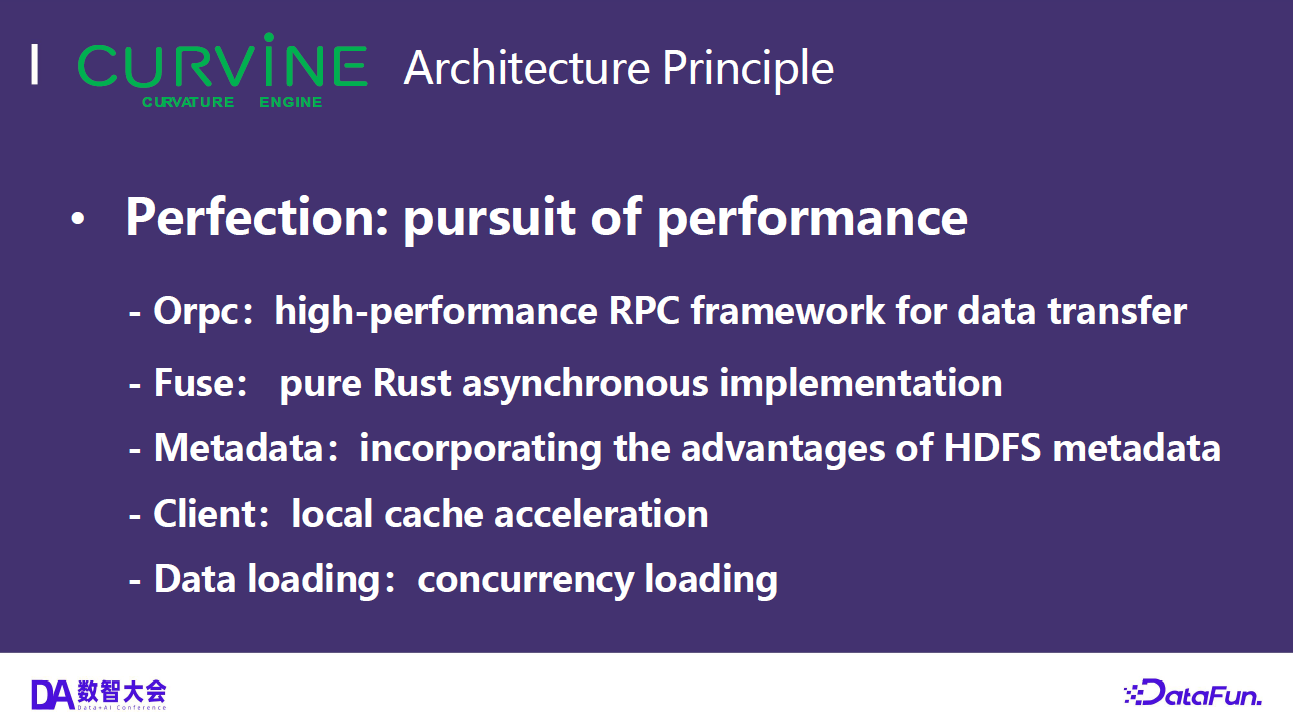
Curvine is a high-performance distributed cache file system written from scratch in Rust. The name comes from "Curvature Engine" — the faster-than-light propulsion device from Liu Cixin's The Three-Body Problem — symbolizing extreme acceleration of data access.
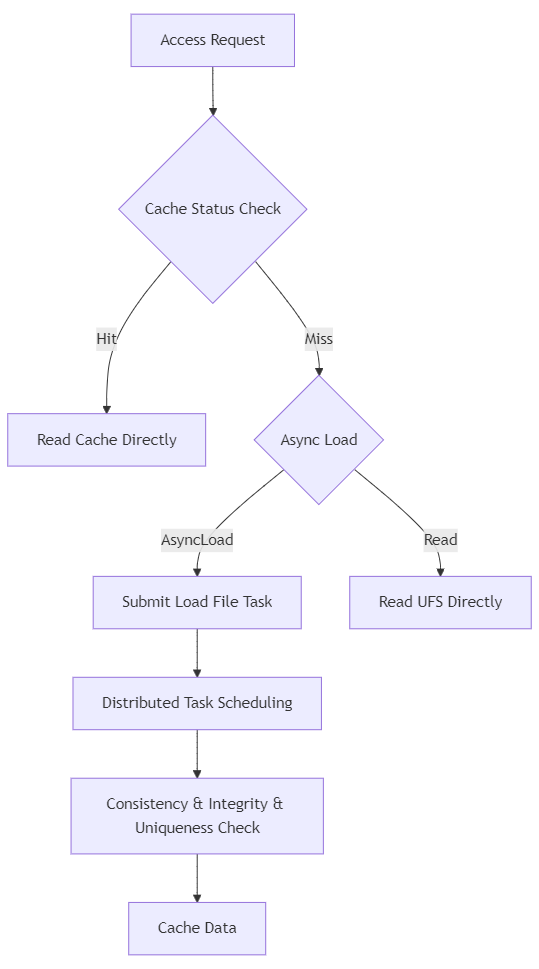
Its core approach: build a distributed file system cache layer on top of cloud object storage (such as S3), providing complete POSIX semantics upward and using object storage as the persistence layer. For Kubernetes workloads, it integrates natively through a CSI driver, mounted directly as PVCs.
2.1 Core Architecture
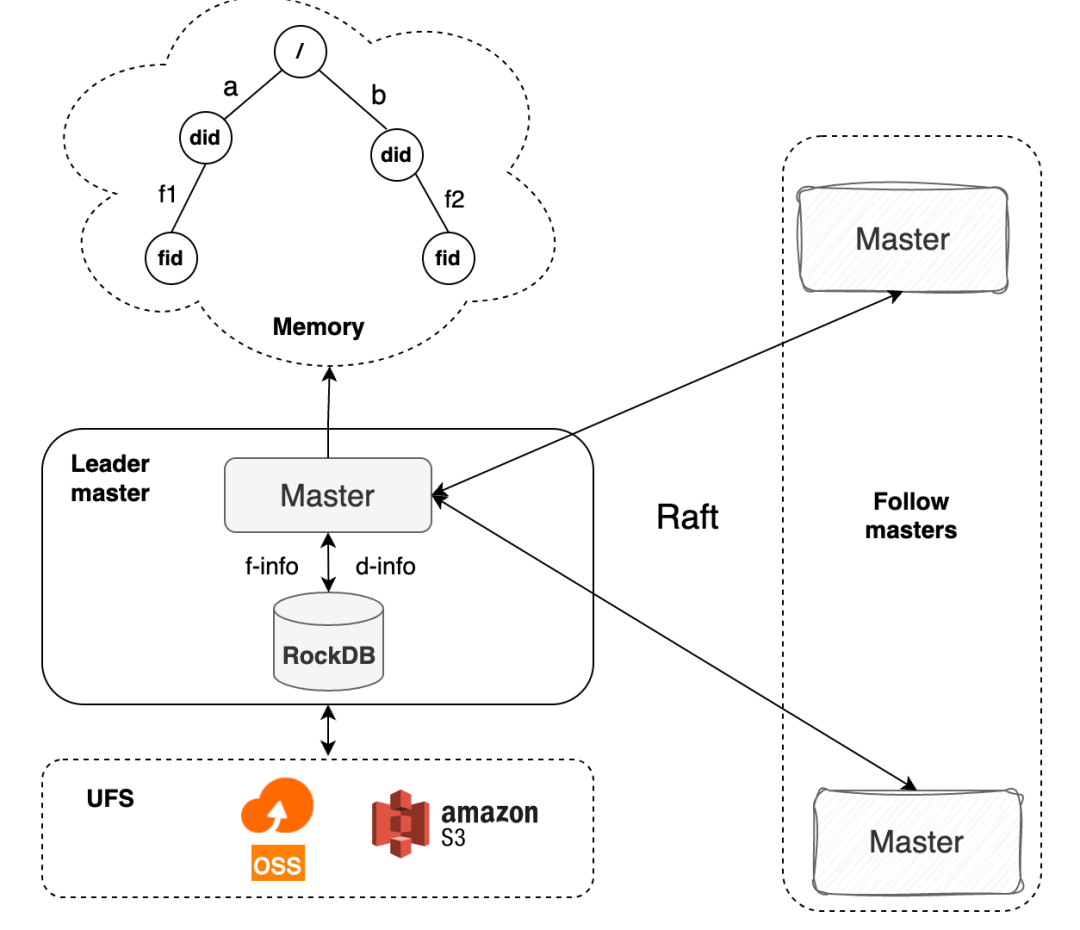
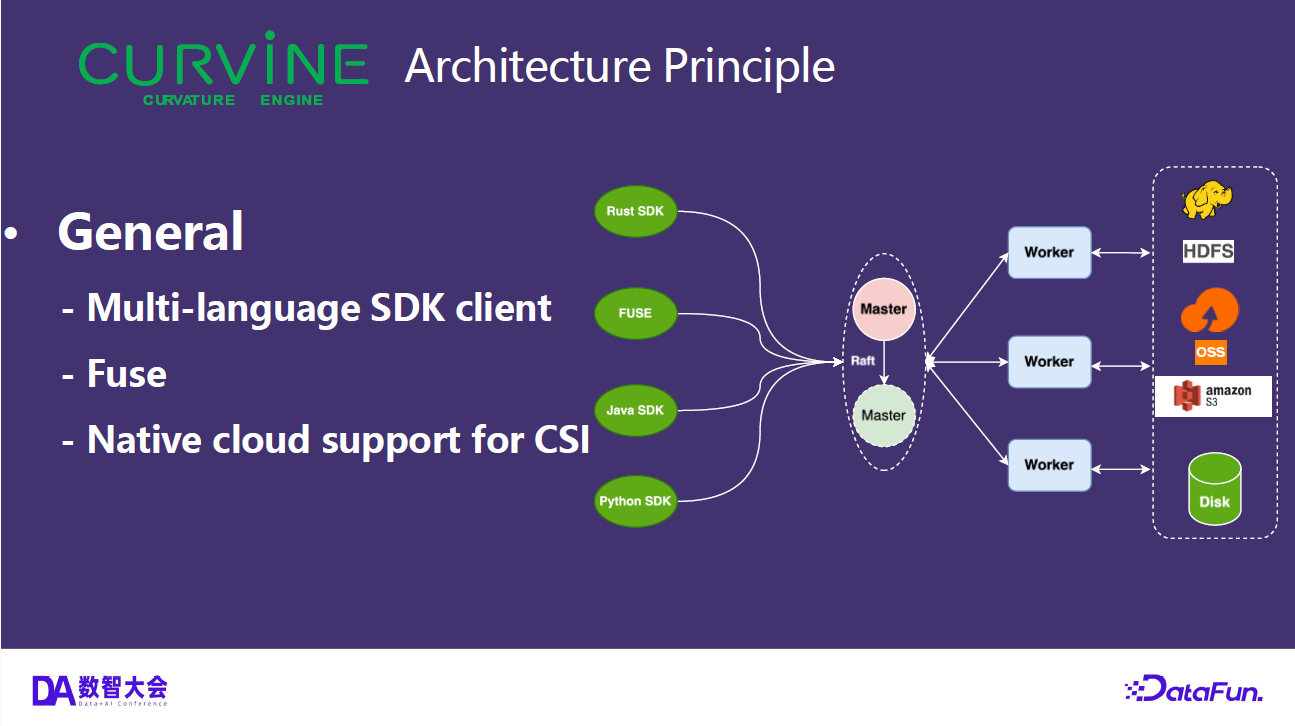
Curvine uses a Master-Worker architecture:
- Master nodes: Manage metadata, coordinate Workers, and handle load balancing. Raft consensus ensures metadata consistency and high availability.
- Worker nodes: Handle actual data caching and serving. Support multi-tier caching across memory, SSD, and HDD, with hot data automatically promoted to faster tiers.
- Client access: POSIX file system interface via FUSE mount; also compatible with S3 and HDFS protocols for integration with existing AI/big data ecosystems.
In Kubernetes environments, Curvine integrates as a CSI driver: the CSI Controller handles dynamic PVC provisioning, and the CSI Node DaemonSet runs on each node to handle FUSE mounts. This means storage provisioning does not call external cloud APIs — it simply creates a directory on the distributed file system, completing in milliseconds.
2.2 How Curvine Differs from JuiceFS
JuiceFS is a pioneer in this space, implemented in Go with a similar "metadata engine + object storage" architecture. Key differences:
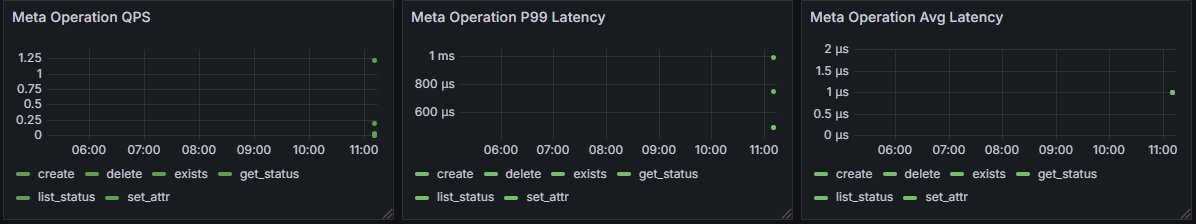
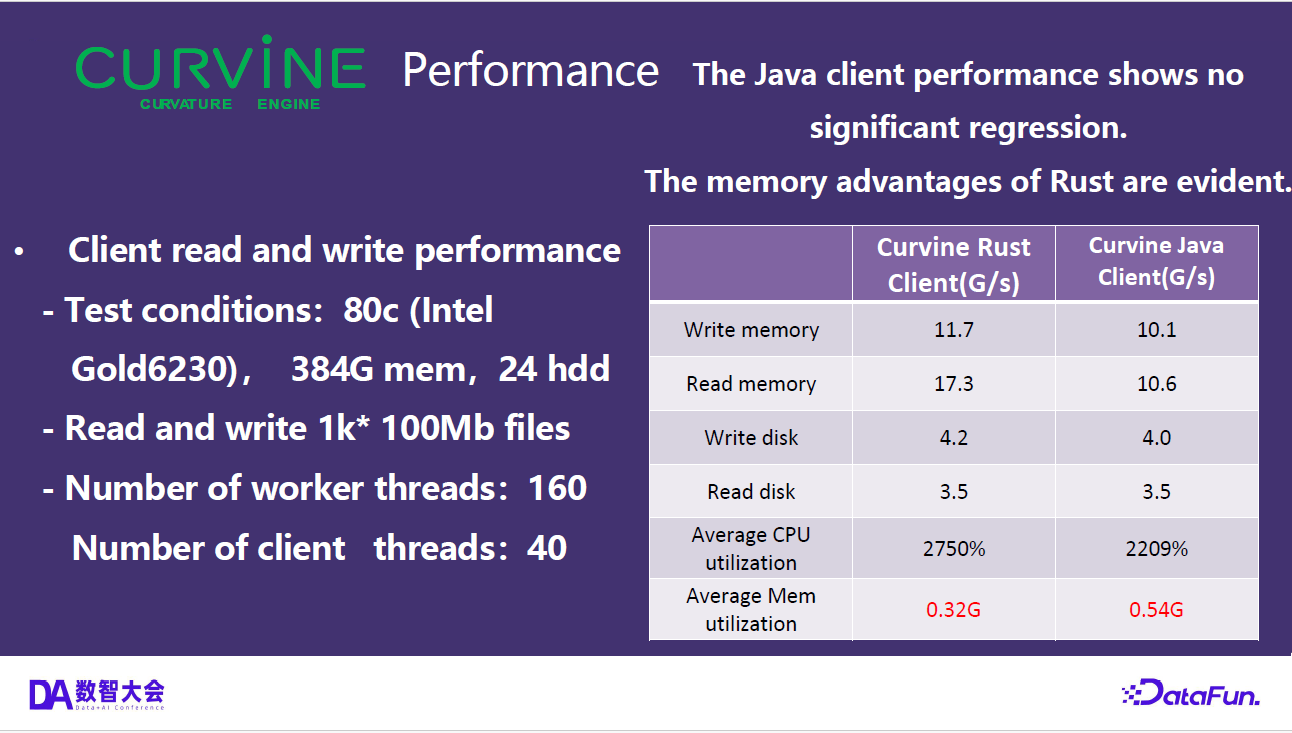
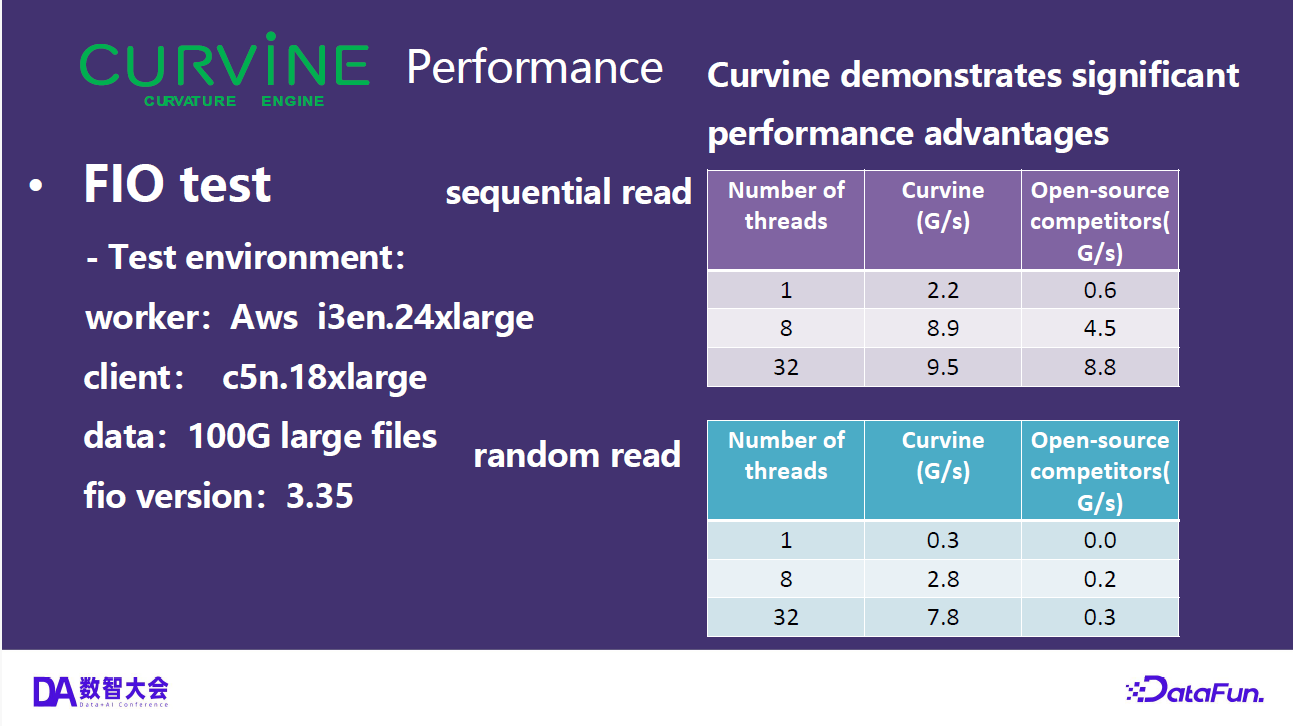
- Performance: Curvine implements core read/write paths in Rust with zero-copy techniques, targeting 100μs-level latency and 100K+ stable QPS. Rust's async runtime (tokio) and GC-free memory model theoretically offer advantages over Go's runtime in high-concurrency small-file scenarios.
- Metadata capacity: Curvine supports up to 5 billion small files per cluster — tens of thousands of Agents each producing small files creates significant metadata pressure.
- Metadata independence: Curvine's file metadata paths correspond one-to-one with underlying S3 object paths. Even if Curvine services fail, files on S3 retain their original structure and remain independently accessible. JuiceFS splits files into blocks, making original files unrecognizable from S3 object names — metadata availability strongly depends on JuiceFS itself.
- Cache architecture: Curvine natively supports automatic multi-tier grading from memory → SSD → HDD. JuiceFS also has local cache capabilities, but Curvine offers more fine-grained cache scheduling strategies.
- Positioning: JuiceFS focuses more on general scenarios and deep cloud vendor integration. Curvine explicitly targets AI training acceleration and Agent cloud-native storage as primary use cases.
Both are excellent open-source projects with active communities, each optimized for different design goals. Specific choices should be evaluated through actual testing based on workload characteristics, team technology stack, and operational preferences. This article does not constitute a recommendation.
2.3 CSI Integration
StorageClass configuration for Curvine on EKS:
apiVersion: storage.k8s.io/v1
kind: StorageClass
metadata:
  name: curvine-sc
provisioner: curvine
reclaimPolicy: Delete
volumeBindingMode: Immediate
allowVolumeExpansion: true
parameters:
  master-addrs: "curvine-master-0.curvine-master.curvine.svc.cluster.local:8995"
  fs-path: "/k8s-volumes"
  path-type: "DirectoryOrCreate"
  io-threads: "4"
  worker-threads: "8"
volumeBindingMode: Immediate means PVCs bind immediately upon creation (without waiting for Pod scheduling). path-type: DirectoryOrCreate means each PVC corresponds to a directory on the Curvine file system — creation is far faster than solutions requiring cloud API calls.
III. 10,000-Pod Benchmark: Validating Scale Feasibility
We conducted a scale validation test on Amazon EKS to answer one question: can Curvine reliably provide persistent storage for 10,000 independent stateful Pods on a production-grade EKS cluster?
3.1 Test Environment
| Parameter | Configuration |
|---|---|
| Region | us-west-2 |
| Kubernetes Version | v1.31.14-eks |
| Compute Nodes | 99 × r6g.4xlarge (Graviton ARM64, 16 vCPU, 128Gi RAM) |
| Node Provisioning | Karpenter auto-scaling |
| Network | VPC-CNI |
3.2 Workload Configuration
| Parameter | Value |
|---|---|
| Deployment | StatefulSet (podManagementPolicy: Parallel) |
| Replicas | 10,000 |
| Per-Pod Resources | 131m CPU / 1190Mi Memory (Guaranteed QoS) |
| Per-Pod Storage | Independent PVC, 1Gi requested |
| Per-Node Pod Density | ~100 Agent Pods + 2 system Pods |
| Node Resource Utilization | CPU 88% / Memory 98% |
3.3 Curvine Storage Cluster
| Component | Count | Description |
|---|---|---|
| Master | 1 | Metadata management |
| Worker | 3 | Data cache service |
| CSI Controller | 1 | Dynamic PVC provisioning |
| CSI Node DaemonSet | 104 | One per node, handles FUSE mounts |
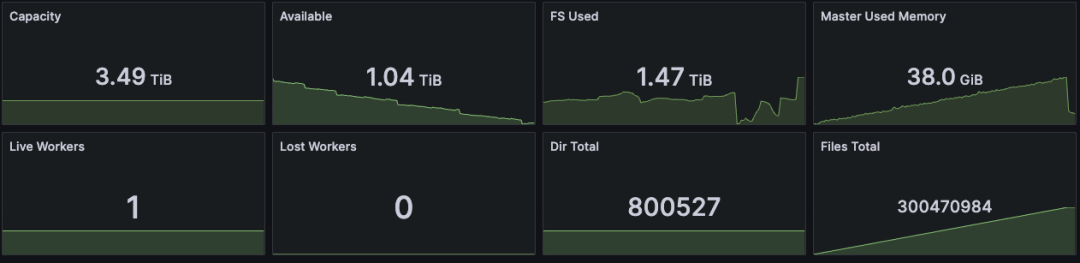
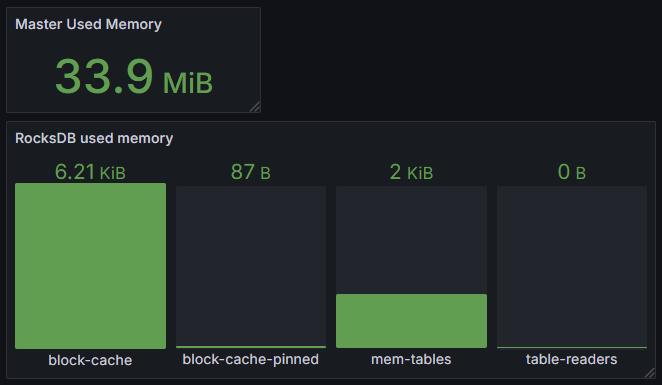
| Storage Cluster Total | 109 Pods |
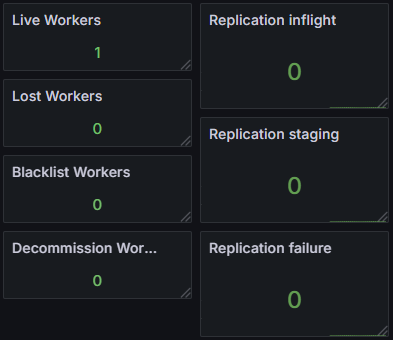
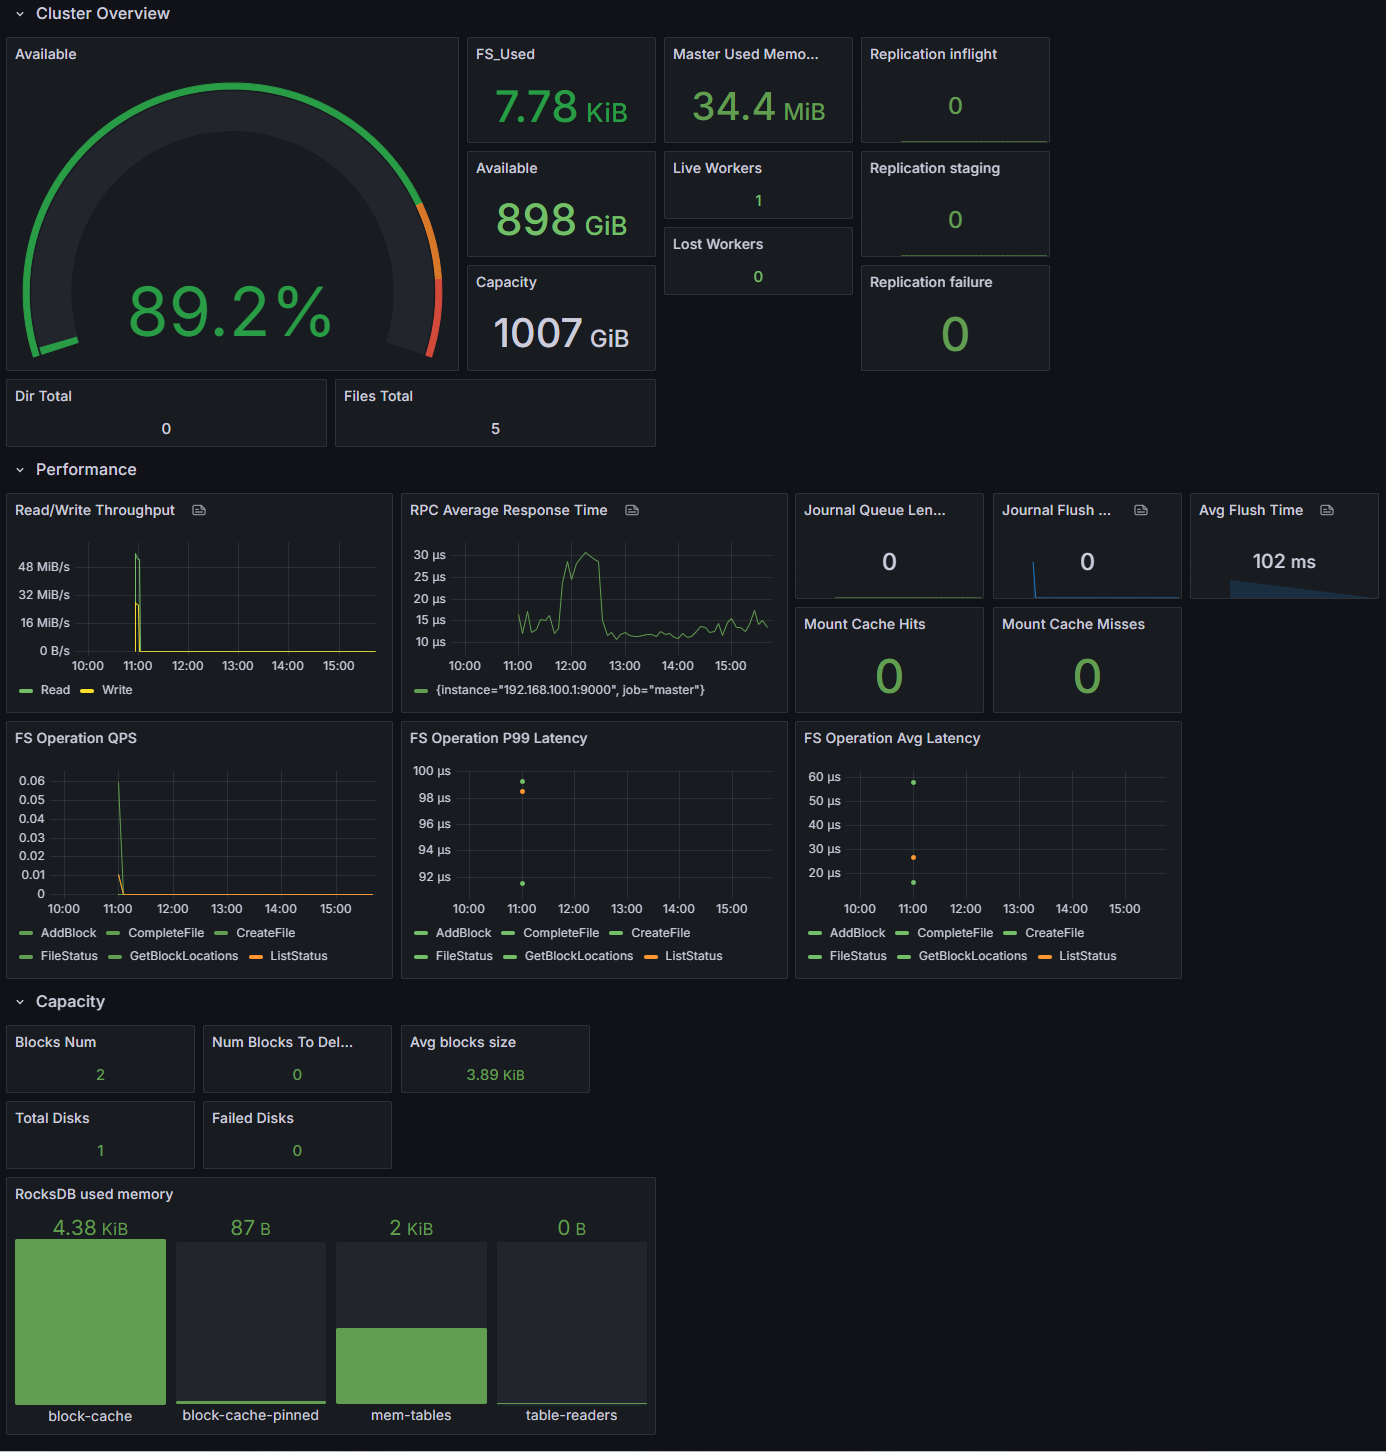
The key number: the storage cluster serving 10,000 PVCs consists of only 1 Master + 3 Worker = 4 core Pods. The CSI Node DaemonSet is a lightweight mount agent that does not consume significant compute resources.
3.4 Test Results
Provisioning Success Rate
- 10,000 PVCs: all Bound, zero Pending, zero Failed
- 10,000 Pods: all Running, zero CrashLoopBackOff, zero storage-related errors
Storage Provisioning Specs
- Each PVC requested 1Gi, actually provisioned ~30Gi (Curvine's minimum allocation unit)
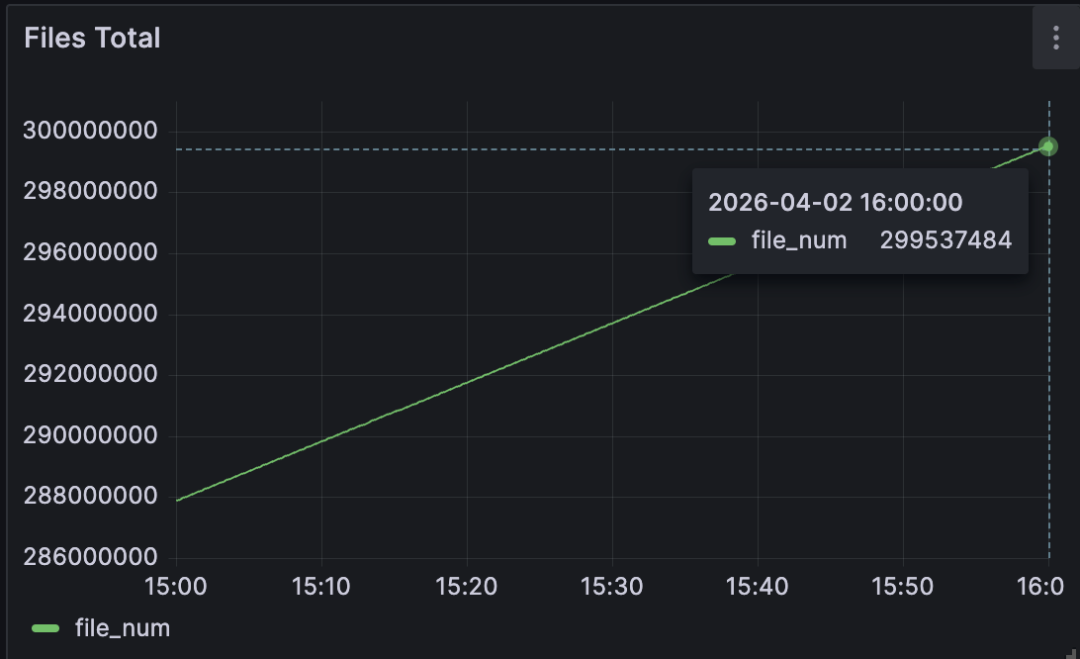
- Total provisioned storage capacity: approximately 300TB
- File system type: curvinefs (FUSE mount)
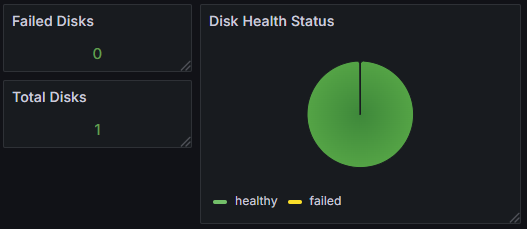
Data Durability Verification
- Wrote and verified data persistence on pod-0, pod-5000, and pod-9999
- Data persisted after Pod restarts
- Consistent file system view after cross-node rescheduling
Pod Distribution Uniformity
102 pods × 98 nodes = 9,996 pods
  4 pods ×  1 node  =     4 pods
Total                = 10,000 pods
Each r6g.4xlarge node stably carried ~100 Agent Pods, with the CSI DaemonSet coexisting without resource contention.
3.5 Storage View Inside Each Pod
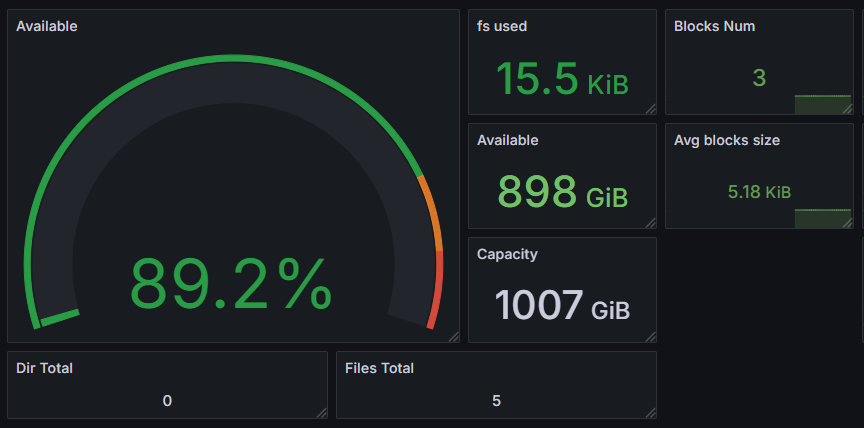
Filesystem    Size      Used     Available  Use%  Mounted on
curvinefs     29.8G     354.6M   29.5G      1%    /usr/share/nginx/html
Each Pod has an independent file system view, invisible to others — the same logical isolation as EBS, but bypassing EBS attachment count limits.
3.6 Key Conclusions
- Provisioning does not depend on cloud control plane APIs: With EBS, creating a PVC triggers the CSI driver to call EBS
CreateVolumeandAttachVolumeAPIs. With EFS, it callsCreateAccessPoint. These cloud APIs have rate limits that cause queuing and slowdowns during mass concurrent creation. Curvine creates a PVC by essentially runningmkdiron its own distributed file system — no cloud vendor API calls, fast and unconstrained by cloud API rate limits. - Minimal storage cluster resource overhead: 4 core Pods serve tens of thousands of PVCs — no need to reserve large compute resources for the storage system itself.
- Per-node Pod density no longer limited by storage: 100 Pods share the same FUSE mount point at different paths, without EBS's 28/128 attachment ceiling.
- Clear horizontal scaling path: Add Worker nodes for greater scale or throughput without affecting existing PVCs.
IV. Getting Started
If you are building an AI Agent platform on EKS and face any of these scenarios:
- Each Agent instance needs an independent POSIX file system workspace
- Total instances in the thousands to tens of thousands with rapid elastic scaling
- High-density stateful Pods per node (>28)
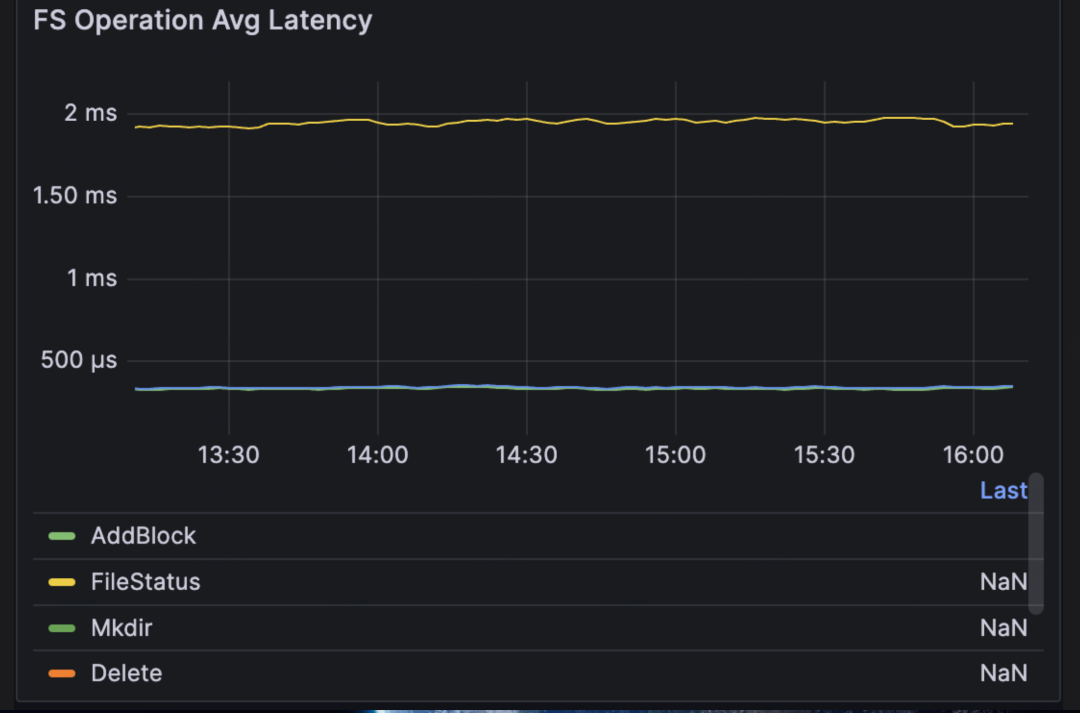
- Sensitive to small-file I/O latency (microseconds vs. milliseconds)
Curvine is worth including in your storage technology evaluation.
Quick Start
- GitHub: github.com/CurvineIO/curvine
- Documentation: curvineio.github.io
- EKS Integration: Deploy Curvine cluster + CSI driver via Helm Chart, configure StorageClass, and start using
Recommended validation path: start with 100–500 Pods to verify provisioning speed and I/O performance; if results meet expectations, gradually scale to thousands or tens of thousands. The storage cluster itself can start with 1 Master + 1 Worker, adding Worker nodes as needed to scale throughput and cache capacity.
Conclusion
The "massive small-scale stateful instances" workload pattern brought by AI Agents poses new challenges for Kubernetes storage. EBS's per-instance attachment limits, EFS's provisioning bottlenecks, and S3's lack of POSIX semantics each fall short in different ways. Curvine, as a distributed cache file system designed for this scenario, validated on EKS that 10,000 independent PVCs can be provisioned and served reliably with minimal storage cluster overhead — providing a practical storage foundation for Agent platform scale-out.